Social Media Reports That Prove Impact and Drive Growth
Learn how social media reports turn metrics into decisions. Types, KPIs, templates and automation tips for social media reports that prove ROI.
You've exported the monthly dashboards, copied the reach and engagement totals into a slide deck, and added a chart for follower growth. Then a stakeholder asks the question the dashboard can't answer: “What should we do next, and how did social contribute to the business?”
That moment exposes the difference between a data dump and useful social media reports. A strong report doesn't merely list activity. It explains what changed, why it likely changed, how performance compares with a meaningful standard, and which decision follows. That matters even more as audiences discover content beyond accounts they already follow and as teams manage several channels with different distribution systems.
Global social media use reached 5.79 billion user identities in April 2026, equal to 69.9% of the world's population, after growing by 294 million identities in the previous 12 months, or 5.4% annually. The typical user actively visits 6.5 platforms each month and spends 18 hours and 36 minutes per week on social media, while more than 15 billion hours of content are consumed on social platforms every day. These figures come from DataReportal's Digital 2026 mid-year global update.
The implication is practical. Your report must help people choose where to invest attention, creative effort, and budget, rather than reward the team for producing more posts. This guide builds that system from first principles, covering report types, normalized KPIs, benchmarks, causal tests, reusable templates, automation, and audience-specific workflows. It also shows where an autonomous AI agent such as Crowbert can execute social work end to end while keeping publishing under human approval.
Table of Contents
Introduction Why Social Media Reports Matter Now
A founder opens a report before a leadership meeting and sees a healthy-looking month. Reach is up. Likes are up. Several videos have strong view counts. Yet the report doesn't say whether the audience became more qualified, whether visitors reached the site, or whether the content changed demand. The numbers are accurate, but the story is incomplete.
That gap exists because social platforms measure activity inside their own environments. They can tell you how many people saw a post, interacted with it, or clicked a visible link. They can't automatically explain whether the content supported a business objective, whether the result was efficient compared with prior activity, or whether the outcome would have happened without the campaign.
A decision-ready report turns dashboard output into a short argument:
- The objective was this.
- The audience response changed in this way.
- The result compares with the benchmark like this.
- The likely drivers were these.
- The next action is this, with a clear owner.
That structure works for a solo founder reviewing a weekly content plan, an in-house team defending a quarterly budget, or an agency reporting across client accounts. The level of detail changes, but the logic stays consistent.
Reporting has also become harder to interpret. A typical user visits multiple platforms each month, so a brand can't assume that follower growth represents total discovery. Content may reach people who haven't followed the account, while a smaller publication schedule can produce better engagement efficiency than a high-volume schedule. A report that focuses only on output can therefore encourage the wrong behavior.
For a practical foundation, see what performance reporting means in practice. The aim isn't to produce more pages. It's to make the next creative, channel, targeting, or budget decision easier to defend.
What Social Media Reports Are and How They Create Value
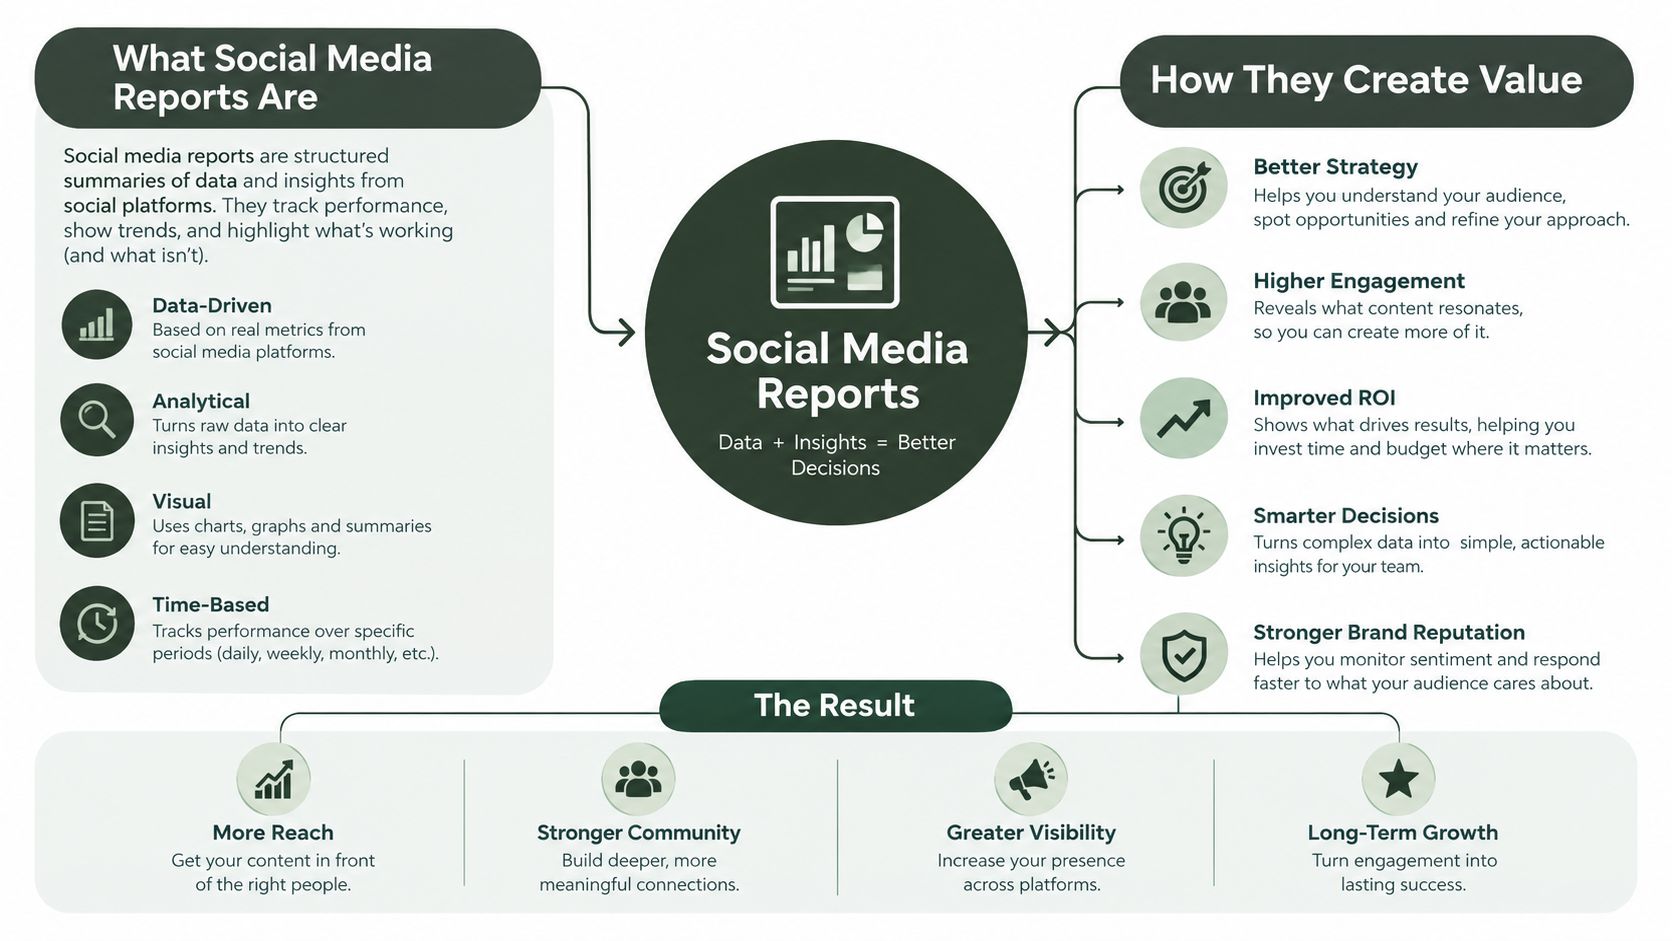
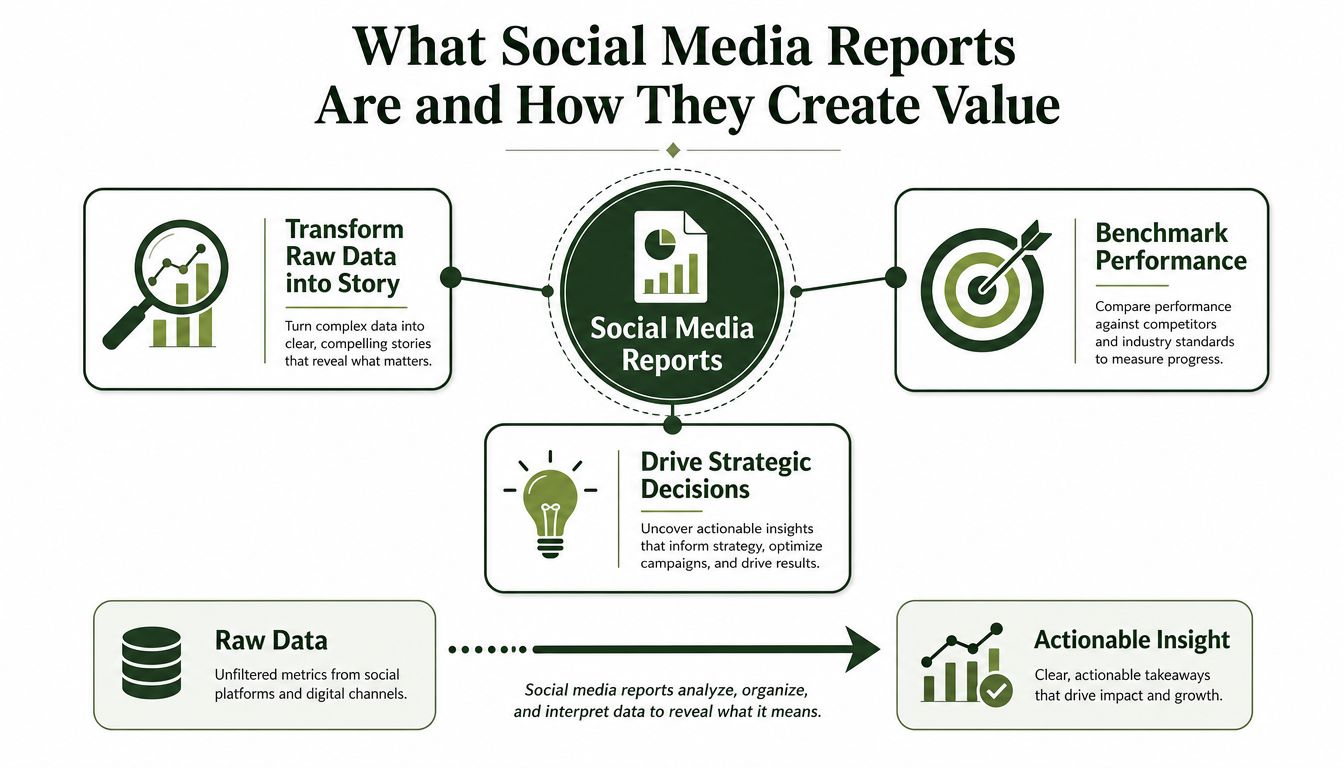
A social media report is an interpreted record of social activity over a defined period. It combines platform data, business context, comparisons, explanations, and recommendations. Native analytics shows what happened inside a channel. A report explains what those events mean for the organization.
A fitness tracker offers a useful analogy. It records steps, heart rate, and sleep. A coach's review goes further by asking whether the training matched the goal, whether performance improved efficiently, and what should change in the next session. Native analytics is the tracker. A social media report is the coach's review.
The three jobs of a report
First, a report documents output. It records publishing volume, reach, impressions, interactions, clicks, video activity, and conversions where measurement allows. This creates an auditable record and prevents teams from relying on memory or isolated screenshots.
Second, it evaluates efficiency. Raw totals favor large accounts and heavily distributed posts. Normalized metrics, such as interactions divided by reach or impressions, make comparisons more useful across posts, periods, and channels. A post with 500 likes can look weaker than one with 200 likes if the second post reached a much smaller audience.
Third, it recommends action. A report should connect evidence to a decision, such as repeating a creative format, changing the opening of a video, reducing low-performing publication volume, reallocating attention to a stronger channel, or testing a different landing page.
The guide to measuring social media success is useful for connecting those actions to objectives. The central question is always, “What business decision should this evidence inform?”
Reports are built around questions
A brand focused on awareness might ask, “Are qualified people discovering us?” Its report needs reach quality, non-follower discovery, content distribution, and audience composition. A brand focused on demand might ask, “Which content creates useful site visits?” Its report needs click-through rate, landing-page behavior, assisted conversions, and conversion quality.
A reporting system becomes valuable when each metric earns its place by answering a question. If a number doesn't change interpretation or action, it may belong in an appendix rather than the main narrative. Crowbert's features overview places content execution and performance reporting in the same workspace, which can help teams connect published work with the results they review.
Types of Social Media Reports and When to Use Each
A founder opens a monthly report and sees reach rising, while qualified site visits are flat. A channel manager sees strong engagement, while the campaign produces few useful leads. Both numbers may be accurate. They answer different questions.
The report type should follow the decision, not the platform. A useful report turns activity into a decision-ready story by showing normalized rates, relevant benchmarks, and tests that separate correlation from likely cause. That matters even more when distribution reaches people who do not follow the account.
Choosing the right report
| Report Type | Best For | Primary Audience | Typical Cadence |
|---|---|---|---|
| Executive summary | Business impact and major decisions | Founders, executives, budget owners | Monthly or quarterly |
| Channel snapshot | Channel health and operating issues | Social leads, channel managers | Weekly or monthly |
| Campaign analysis | Evaluating a defined initiative | Marketing, creative, media, sales | At launch completion or milestone |
| Content performance | Finding repeatable creative patterns | Content and creative teams | Weekly or monthly |
| Audience and competitor benchmark | Comparing position and efficiency | Strategy, leadership, account teams | Monthly or quarterly |
| Conversion and ROI report | Connecting social activity to outcomes | Growth, finance, executives | Monthly or campaign-based |
An executive summary should fit on a page whenever possible. Show the objective, major movement, business implication, risk, and next actions. A founder does not need every post. They need to know whether the result supports a budget, audience, or creative decision.
A channel snapshot is operational. It shows whether the channel is earning attention efficiently, whether distribution is shifting toward non-followers, and whether publishing or content choices need adjustment. Use consistent denominators so a larger audience or broader reach does not make raw totals look like improved performance.
A campaign analysis isolates one defined effort. Include its audience, offer, creative, timing, landing experience, outcome, and comparison with a baseline. If the team changed several variables at once, label the result as an association rather than proof that one change caused the outcome. A holdout, matched comparison, or clearly timed test gives the conclusion more weight.
A content performance report identifies patterns across posts. Compare hooks, formats, themes, calls to action, audience mix, and response rates. The goal is not to crown one viral post. It is to find a repeatable behavior worth testing again, then record what changed and what stayed constant.
Combining report types
A monthly reporting pack can combine an executive summary, channel snapshots, content analysis, and a conversion view. A campaign post-mortem should be narrower, with more attention to test design, audience, creative variables, and incremental outcome.
Benchmark reports create a reference point from internal history, direct competitors, or industry averages. Compare the same platform, a similar timeframe, and an equivalent audience size where possible. Benchmarking works like using the same ruler for every measurement. Without a consistent basis, a higher rate may reflect a different denominator rather than better work. Document the comparison rules and label whether the benchmark is internal, competitive, or industry-based.
Agencies may need a workspace-level view across client accounts, followed by account-specific detail. Crowbert's agency solutions can support coordination of execution and reporting across separate workspaces without mixing client context.
For the operational boundary, social media monitoring explained clarifies why listening for mentions is only one part of reporting. Monitoring supplies evidence about conversations and reactions. The report interprets that evidence, connects it with business outcomes, and recommends the next decision.
Key Metrics and KPIs That Actually Explain Performance
A post can reach many people and still produce little business value. Another can reach fewer people but generate qualified visits or useful conversations. A report explains that difference by connecting each metric to an objective, a denominator, a benchmark, and a decision. The social media KPIs glossary can help align definitions before teams compare results.
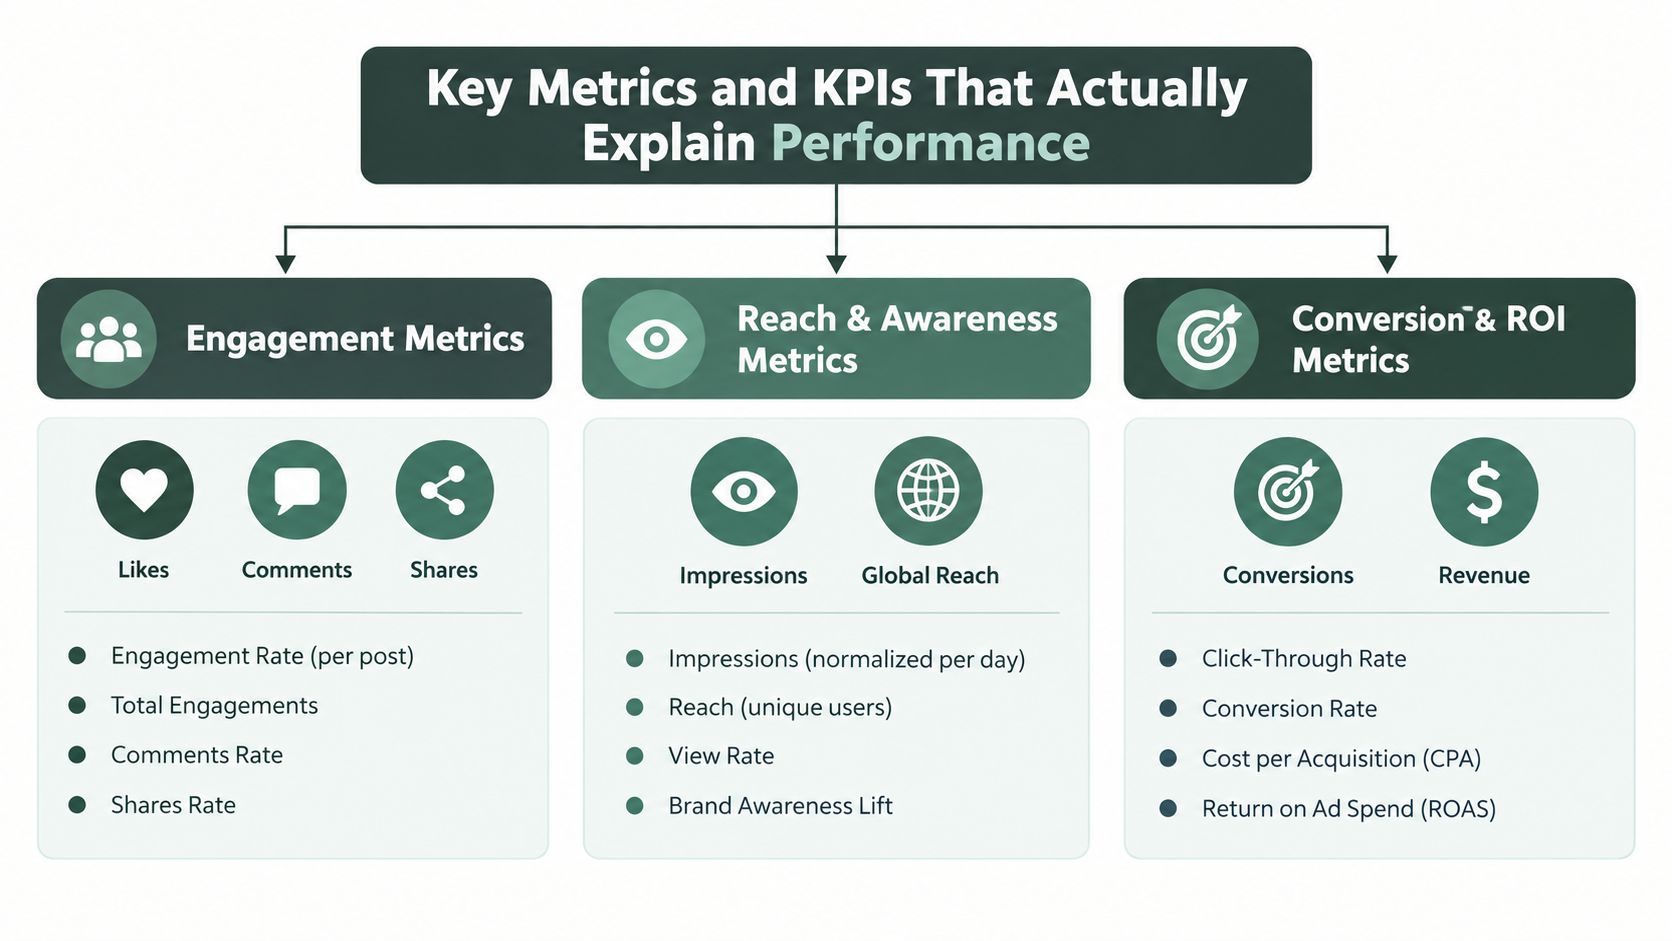
Use three connected groups: engagement metrics, performance metrics, and conversion metrics. This structure keeps social activity from becoming a self-contained scorecard.
Engagement metrics
Engagement metrics include likes, comments, shares, saves, mentions, and other interactions. They show whether people responded, but raw totals do not show efficiency. A large audience can produce a high count through distribution alone, while a smaller relevant audience may respond at a higher rate.
A normalized engagement rate divides interactions by a relevant exposure or audience base. The denominator matters because channels differ in audience size, distribution, and delivery. Common formulas include:
- X or Twitter-style reporting: post interactions divided by impressions.
- LinkedIn-style reporting: interactions divided by impressions.
- Facebook-style reporting: interactions divided by reach.
Choose one formula for each comparison and label the denominator plainly. “Engagement rate” without that information is incomplete. A rate calculator can standardize calculations across supported channels, but always show the underlying counts as well. The rate answers an efficiency question. The count shows the scale of response.
Performance and conversion metrics
Performance metrics describe distribution and movement. They include reach, impressions, profile visits, video views, link clicks, and click-through rate. Conversion metrics include conversions, assisted conversions, revenue quality, and return on investment when tracking is reliable.
Connect the levels in a clear chain:
Output records what people did. Efficiency shows how much response the distribution generated. Business outcome shows whether that response mattered.
| Metric group | Useful measures | Interpretation |
|---|---|---|
| Engagement | Likes, comments, shares, mentions, engagement rate | Did the audience respond, and how efficiently? |
| Performance | Reach, impressions, traffic, profile visits, CTR | Did content earn distribution and movement? |
| Conversion | Conversions, assisted conversions, ROI, revenue quality | Did social support a valuable business outcome? |
A report should show both totals and rates. The same principle applies to traffic: clicks describe activity, while click-through rate relates that activity to exposure. For reporting conventions and metric selection, social media reporting metrics guidance offers a reference point.
Benchmarks and causal tests
A benchmark gives a result a reference point. Compare current performance with the same account's historical results, a relevant channel norm, or a carefully selected peer group. Keep the comparison basis consistent. A higher rate may reflect a different denominator rather than better work, just as a ruler with changing units cannot support a fair comparison. Record whether the benchmark is internal, competitive, or industry-based.
Causality requires a separate test. A rise in clicks may occur alongside a product launch, seasonal demand, paid distribution, or a website change. To estimate incremental impact, define what would likely have happened without the campaign, establish a baseline, and use a controlled test when possible. Counterfactual reasoning, benchmarks, and A/B tests provide a stronger basis for causal evaluation than simple before-and-after movement.
Compare these statements:
“The campaign generated more clicks than the prior period.”
“The campaign exceeded the pre-defined benchmark, and the test separated the new creative from the control.”
The second statement supports a decision because it identifies a reference point and a test condition. The first only records change.
For channel-specific measurement ideas, ClipCreator.ai TikTok growth tips provides additional context for reading platform data. Use that guidance to improve diagnosis, while keeping objectives, formulas, and benchmarks specific to your business.
Report follower and non-follower distribution whenever the channel provides it. Reach now often extends beyond the follower base, so follower growth alone cannot represent discovery or business impact. A post may create value by reaching a relevant new audience and producing qualified visits, even when it adds few followers.
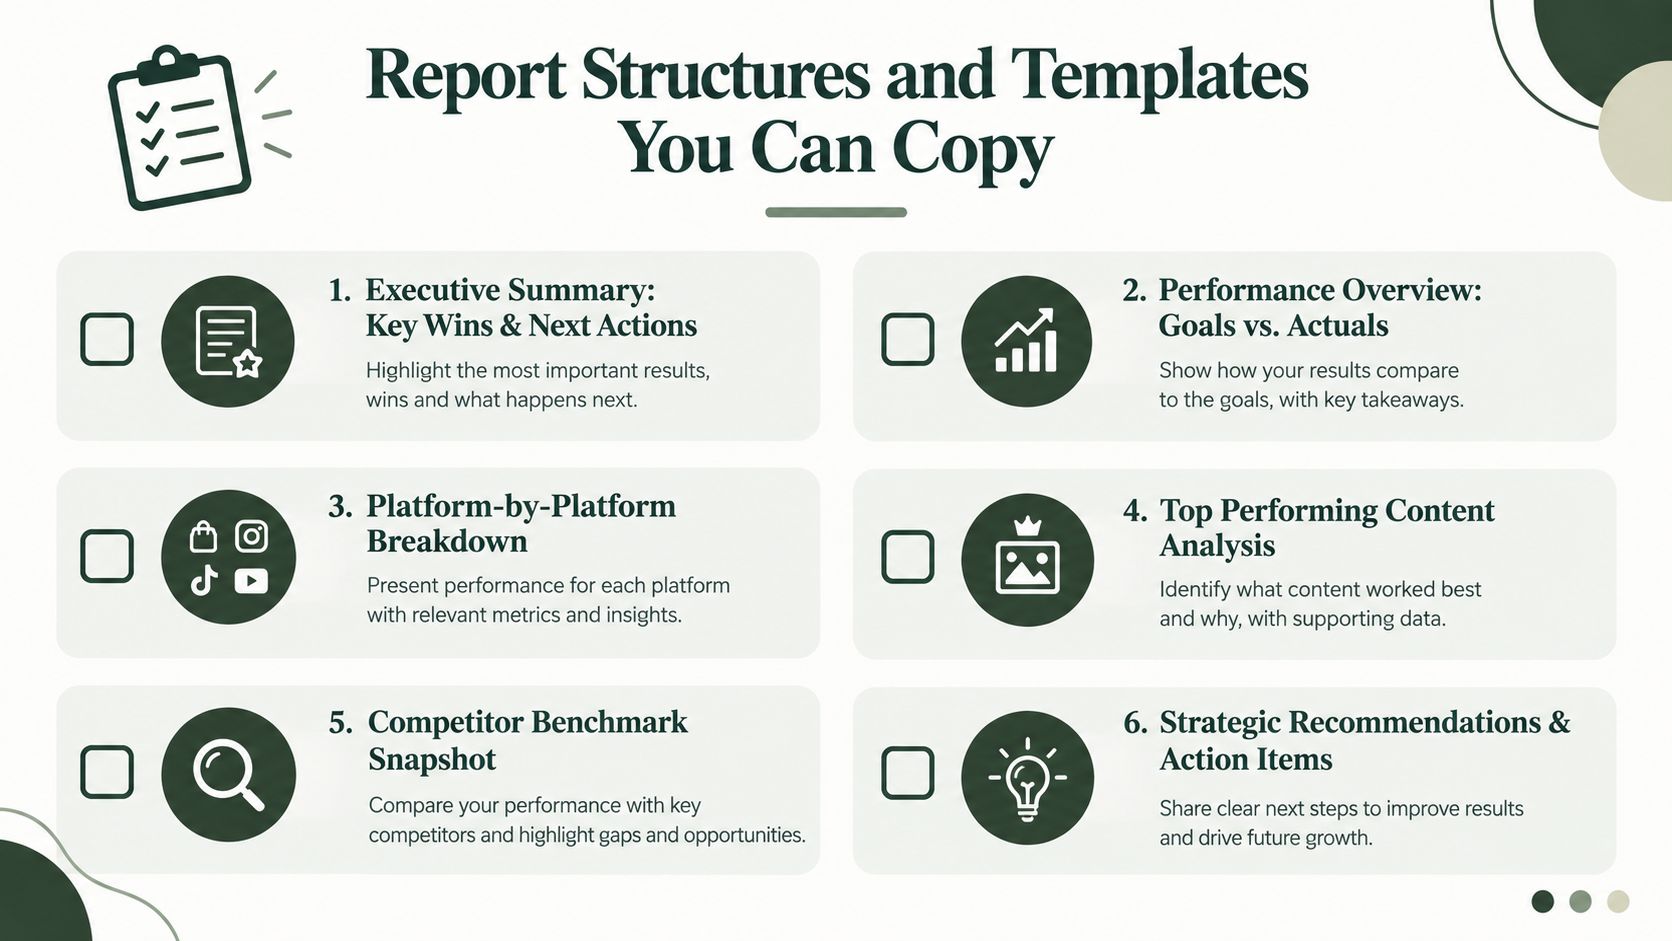
Report Structures and Templates You Can Copy
A repeatable report should make the reader's path obvious. Start with the business question, show the evidence, interpret the change, and end with an action. Visual polish helps, but hierarchy matters more than decoration.
The monthly report
Use six blocks:
- Executive summary: State the objective, two or three material findings, and the next actions. Keep this concise.
- Performance overview: Compare targets, current results, and prior or benchmark performance. Show rates alongside totals.
- Channel snapshots: Give each channel a consistent treatment, but preserve channel-specific formulas and context.
- Content analysis: Show the strongest and weakest examples, then explain the common creative traits.
- Audience insight: Include audience changes, discovery beyond followers, comments, questions, and intent signals.
- Recommendations: Assign actions to a person or team and state what will be tested, repeated, stopped, or investigated.
The content section shouldn't become a gallery. Select examples that help explain a pattern. If a short video performed well, identify whether the opening, topic, pacing, proof, or call to action may have contributed.
The campaign report
A campaign report needs a tighter narrative:
- Objective and audience
- Campaign dates and channels
- Creative and offer
- Baseline or control
- Distribution and engagement efficiency
- Traffic and conversion quality
- Causal limitations
- Decision and next test
State what the data cannot prove. Privacy restrictions, incomplete cross-platform tracking, and delayed conversions can make direct attribution unreliable. That limitation doesn't make the report useless. It means you should include assisted conversions, directional evidence, and test results instead of presenting an inflated claim of certainty.
The executive one-pager
An executive page should answer five questions:
- What did we intend to achieve?
- What changed?
- Why do we believe it changed?
- What does it mean for the business?
- What decision is needed now?
Use one main conclusion as the visual headline. Put supporting detail below it. A chart should have a conclusion, not merely a label. “Engagement” is a label. “Short-form product demonstrations earned stronger response efficiency than announcement posts” is a conclusion that invites action.
Scaling these templates across workspaces becomes easier when reporting fields, date ranges, definitions, and approval rules are standardized. Teams evaluating the operational cost can review Crowbert pricing and its reporting and execution features, then decide whether centralized automation fits their workflow.
How to Build Repeatable Reports and Automate Without Losing Insight
Automation should remove repetitive collection and formatting. It shouldn't remove judgment. The most reliable workflow separates mechanical tasks from interpretive tasks, then gives a human authority over conclusions and publishing.
Build the reporting loop
- Define the decision first. Write the business objective, reporting question, primary KPI, supporting metrics, and acceptable benchmark before collecting data.
- Connect the sources. Bring in platform analytics, web analytics, CRM outcomes, campaign records, and customer-quality signals where available.
- Standardize the window. Use the same start and end dates for comparisons. Record time zones, attribution windows, and formula definitions.
- Normalize the data. Calculate engagement rates, click-through rates, conversion rates, and other efficiency measures using channel-appropriate denominators.
- Automate the snapshot. Schedule data pulls, charts, alerts, and recurring report drafts. Automation is especially useful for workspace-level summaries and recurring client packs.
- Add human interpretation. Explain the likely drivers, note confounding factors, and distinguish observation from inference.
- Approve and review. Give a named owner responsibility for sign-off, then hold a review focused on decisions rather than presentation edits.
A report can be generated automatically and still be strategically weak. The analyst must decide whether a change reflects content quality, distribution, timing, audience mix, competition, seasonality, or measurement noise.
Match the workflow to the team
A solo founder should use a short weekly operating view and a deeper monthly review. Keep the weekly version focused on the next content decision, not every available metric.
An in-house team should maintain a shared KPI dictionary, channel owners, and a monthly decision meeting. Separate the executive summary from the working analysis so leadership sees the conclusion without losing the evidence trail.
An agency needs reusable definitions, client-specific objectives, permission boundaries, and a consistent approval process. The team should be able to compare account health without forcing every client into the same success definition. Managing client accounts provides relevant workflow context for this operating model.
Where autonomous execution fits
Crowbert is an autonomous AI agent for social media work. It can coordinate content creation, channel-aware formatting, scheduling, publishing, engagement workflows, and performance reporting across connected channels, while human approval remains required before publishing. That differs from a monitoring-only setup because the agent can carry work from brief through execution and report-back, with the human reviewing the proposed output and decisions.
Smart rescheduling, reposting based on performance, workspace-level snapshots, and a Telegram-connected workflow can reduce handoffs, but they don't eliminate the need for measurement discipline. Teams comparing reporting and execution workflows can use automated reporting examples from ELECTE as a reference for how recurring reporting processes may be organized.
Frequently Asked Questions About Social Media Reports
How often should we send social media reports?
Send a short operating view weekly when the team needs to adjust content or distribution quickly. Send a fuller report monthly for management and budget decisions, and use campaign reports when a defined initiative reaches a meaningful review point. The cadence should follow the decision cycle, not the availability of a dashboard export.
How can we prove ROI when attribution is messy?
Use a layered evidence model. Combine direct conversions with assisted conversions, qualified traffic, revenue quality, historical benchmarks, and controlled tests where possible. State the limits clearly, and don't present correlation as incremental impact.
What should we report when reach increasingly comes from non-followers?
Separate follower and non-follower discovery where the platform provides the data. Report the quality of that discovery through engagement efficiency, profile actions, site visits, conversion signals, and audience relevance. Follower growth can remain useful, but it shouldn't be the only measure of expanding demand.
How can agencies standardize reports without making every client look identical?
Standardize the mechanics, not the business objectives. Use shared definitions, date windows, formatting, approval steps, and metric calculations, then customize the primary question, benchmark, audience, and recommendation for each client.
Should we include revenue in every report?
Include revenue or revenue-quality measures when the tracking setup supports a defensible connection. Otherwise, report the strongest available leading and assisted indicators, document the measurement gap, and propose a test or instrumentation improvement. For creator and video-led businesses, supporting analysis such as the YouTube money calculator can help frame monetization questions without replacing business-specific financial reporting.
Crowbert coordinates social content creation, channel-aware publishing, engagement workflows, and performance reporting through an autonomous AI agent, with human approval before anything ships. Visit Crowbert to see how an end-to-end workflow can turn social media reports from retrospective dashboards into repeatable decisions.
About the Author
The team behind Crowbert building AI-powered marketing tools that help businesses of all sizes create professional campaigns, manage social presence, and drive real results.


