Social Media Analytics Report: Build, Automate, Interpret
Build a social media analytics report that proves ROI. Covers KPIs, structure, automation, cadence, and how an AI agent can run reporting end to end.

A social media analytics report that counts only clicks is already missing part of the story. In one 2026 analysis, organic social influence reported by users exceeded tracked attribution on every major platform examined, including LinkedIn, TikTok, Facebook, Instagram, and YouTube. The gap was especially wide for LinkedIn and TikTok, where self-reported influence was 4.12% versus 0.61% tracked on LinkedIn and 2.07% versus 0.29% tracked on TikTok (analysis of tracked versus self-reported organic social conversions).
That doesn't make native conversion data useless. It means a serious report needs to distinguish what platforms can prove, what web analytics can connect, and what social activity influenced without receiving last-click credit. The report should become a living decision product, refreshed by an accountable owner or autonomous agent, rather than a quarterly slide deck assembled after the decisions have already been made.
Table of Contents
Why a Social Media Analytics Report Matters in 2026
The scale of the audience and the software category has changed the job. DataReportal's 2026 global overview reports 5.66 billion social media user identities, representing 68.7% of the global population (DataReportal's Global Overview Report). A separate market forecast estimates the social media analytics market at USD 7.57 billion in 2026, rising to USD 17.81 billion by 2033 at a 13.0% CAGR (Coherent Market Insights social media analytics market forecast).
Those figures matter for a practical reason. Social teams now operate across several channels, content formats, paid and organic campaigns, and increasingly restricted platform data. A report that arrives after a campaign ends can describe performance, but it can't reliably guide the next publishing decision. Weekly reporting creates a feedback loop while the content system can still respond.
A useful report has four connected parts:
- KPI selection, tied to the funnel stage and the business decision.
- Template design, built for fast stakeholder scanning rather than data storage.
- Data normalization, so platform metrics are comparable and reproducible.
- Automated interpretation, which turns recurring signals into recommendations while leaving material decisions to people.
Ownership matters as much as layout. Assign one person, team, or agent to review the report on a fixed weekly cadence. That owner should investigate anomalies, document methodology changes, and carry recommendations into the content calendar. Without ownership, even an accurate dashboard becomes an archive.
The report also needs a clear audience. Executives usually need business outcomes and risks. Channel owners need post-level patterns and timing signals. Agencies need a client-ready narrative with evidence, assumptions, and next actions. One report can serve all three, but it should use a short front layer and deeper supporting views.
Choosing the Right KPIs for Your Report
Start with the decision, not the platform export. A brand-awareness program needs visibility and audience growth measures. A demand program needs clicks, qualified sessions, conversions, and revenue contribution. A report that includes every available metric forces stakeholders to find the important information themselves.
Build the KPI set from awareness to conversion
Awareness begins with impressions, reach, and follower growth rate. Impressions describe delivery volume, while reach indicates the unique audience exposed to content. Follower growth shows whether the account is building an owned audience over time. These measures belong together, but they shouldn't be collapsed into a single score.
Engagement requires more than likes. Track total interactions, engagement rate, saves, and share rate. Calculate engagement using a denominator that fits the platform and the question, such as reach or impressions. The recommended formulas include ER_impressions = total interactions ÷ impressions, ER_reach = total interactions ÷ reach, and ER_followers = total interactions ÷ followers at post time (Brandwatch's social media benchmarking guidance).
Traffic and conversion should follow the path from click-through rate to conversion rate, CPA, and attributed revenue. A conversion-oriented report should connect social links to web analytics through UTM parameters, then carry landing page visits, leads, purchases, and revenue into the same reporting model (Supermetrics' social media reporting guide).
Use platform-specific benchmarks, historical baselines, and an industry reference together. Comparisons only work when the platform, period, audience scale, and paid or organic status are comparable. A 0.5% engagement rate can be strong in context, while a neutral benchmarking guide cites a Facebook industry median near 0.15% (Socialinsider's social media benchmarks).
Exclude metrics that don't change a decision. Raw follower count, total likes without reach, and cumulative impressions often create impressive-looking but operationally weak slides. Keep them only when they support a defined question.
For a defensible custom score, use this copy-ready formula:
Weighted engagement rate = (likes × 1 + comments × 3 + shares × 5 + saves × 4) ÷ reach
This is an editorial scoring model, not a universal industry standard. Document the weights, keep the underlying counts visible, and don't compare the score with a native engagement rate as if they were identical. Teams that need a broader framework can also use this practical monitoring and metrics guide. For the operating principles behind outcome-based measurement, see how to measure social media success.
Report Structure and Templates That Stakeholders Actually Read
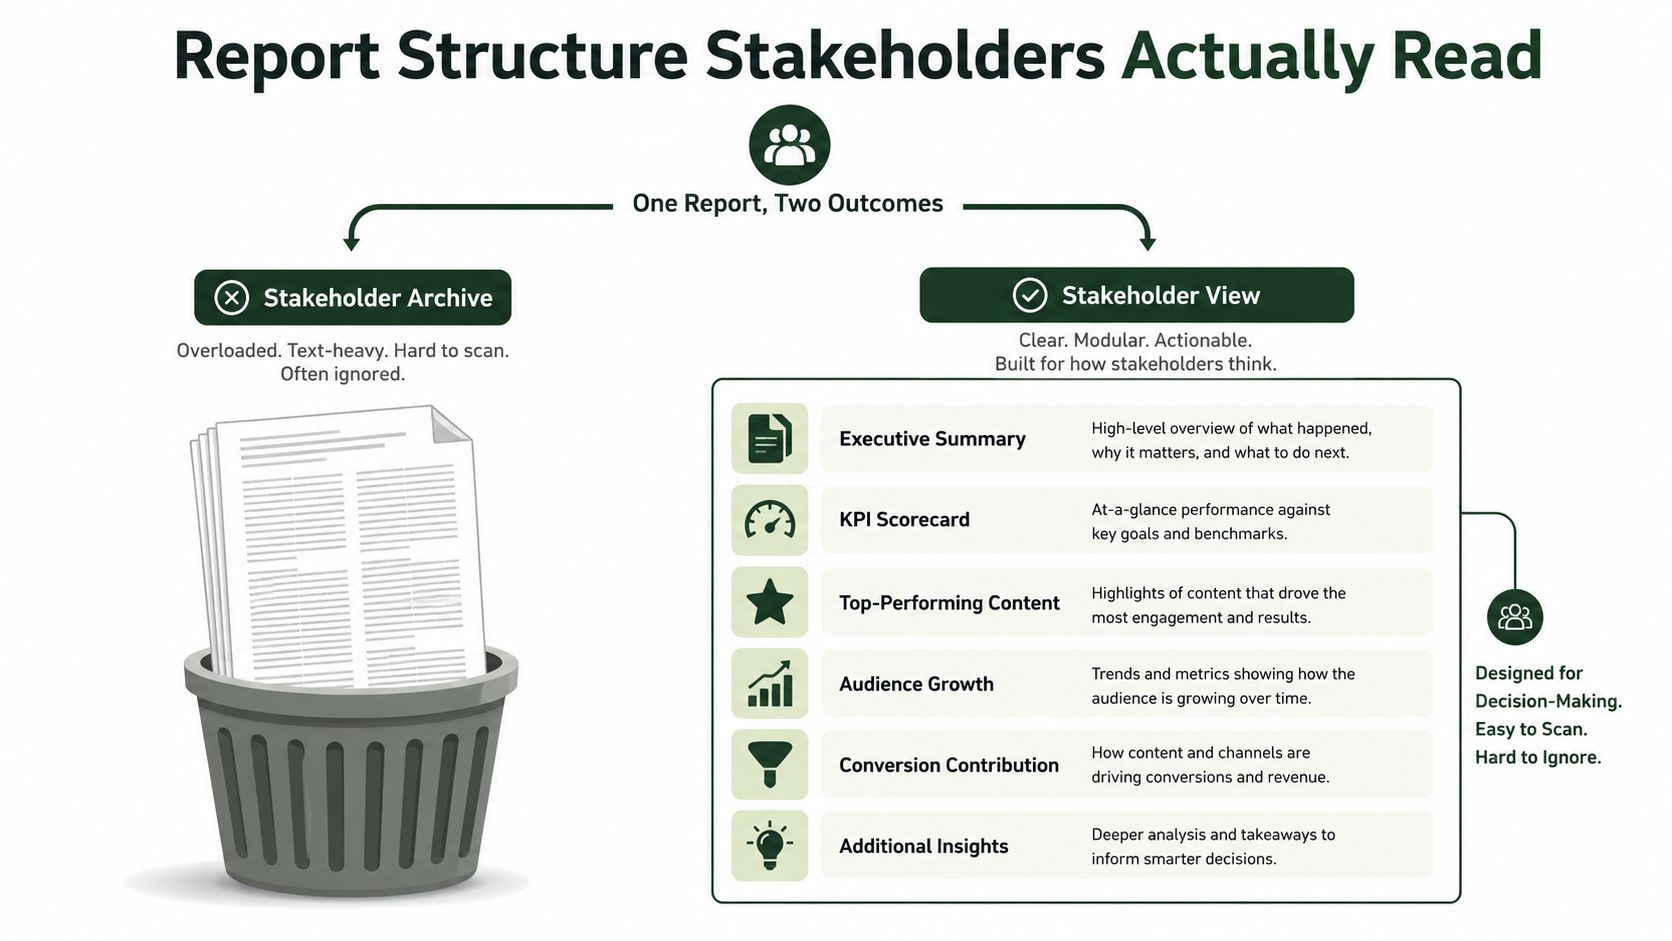
Stakeholders don't ignore reports because they dislike data. They ignore reports that make them perform the analysis themselves. The first page needs a fixed structure, consistent definitions, and a clear recommendation. If the headline changes position every month, readers spend their attention locating information instead of evaluating it.
Use named blocks with a stable order
A practical template should contain:
- Executive summary: State the primary movement, the reason behind it, and the decision required.
- KPI scorecard: Show current value, month-over-month change, benchmark context, and status.
- Top-performing content: Link the strongest posts to their themes, formats, calls to action, and distribution conditions.
- Audience growth: Separate follower movement from reach expansion and note unusual audience changes.
- Conversion contribution: Present clicks, engaged sessions, leads, conversions, assisted influence, and attributed revenue.
- Risks and recommendations: Identify measurement gaps, creative fatigue, platform dependency, or budget concerns, then assign an action.
The month-over-month comparison rule should be consistent for every platform and KPI. Show the current period, the previous comparable period, and the change. Use the same date boundaries, timezone, attribution definition, and paid or organic treatment throughout. If a campaign breaks the normal baseline, flag it rather than allowing a percentage change to stand without context.
Executives need the summary, scorecard, business contribution, and decisions. Channel owners need the content leaderboard, audience details, and post-level diagnostics. Clients need the commercial narrative, agreed benchmarks, delivery status, and next actions. Keep the first slide fixed across audiences, then vary the depth behind it.
A readable report is also an operating agreement. It tells everyone which numbers count, how often they update, and who responds when a metric moves unexpectedly. A concise guide to performance reporting can help teams align that reporting layer with broader marketing review practices.
Data Collection, Normalization, and Visualization
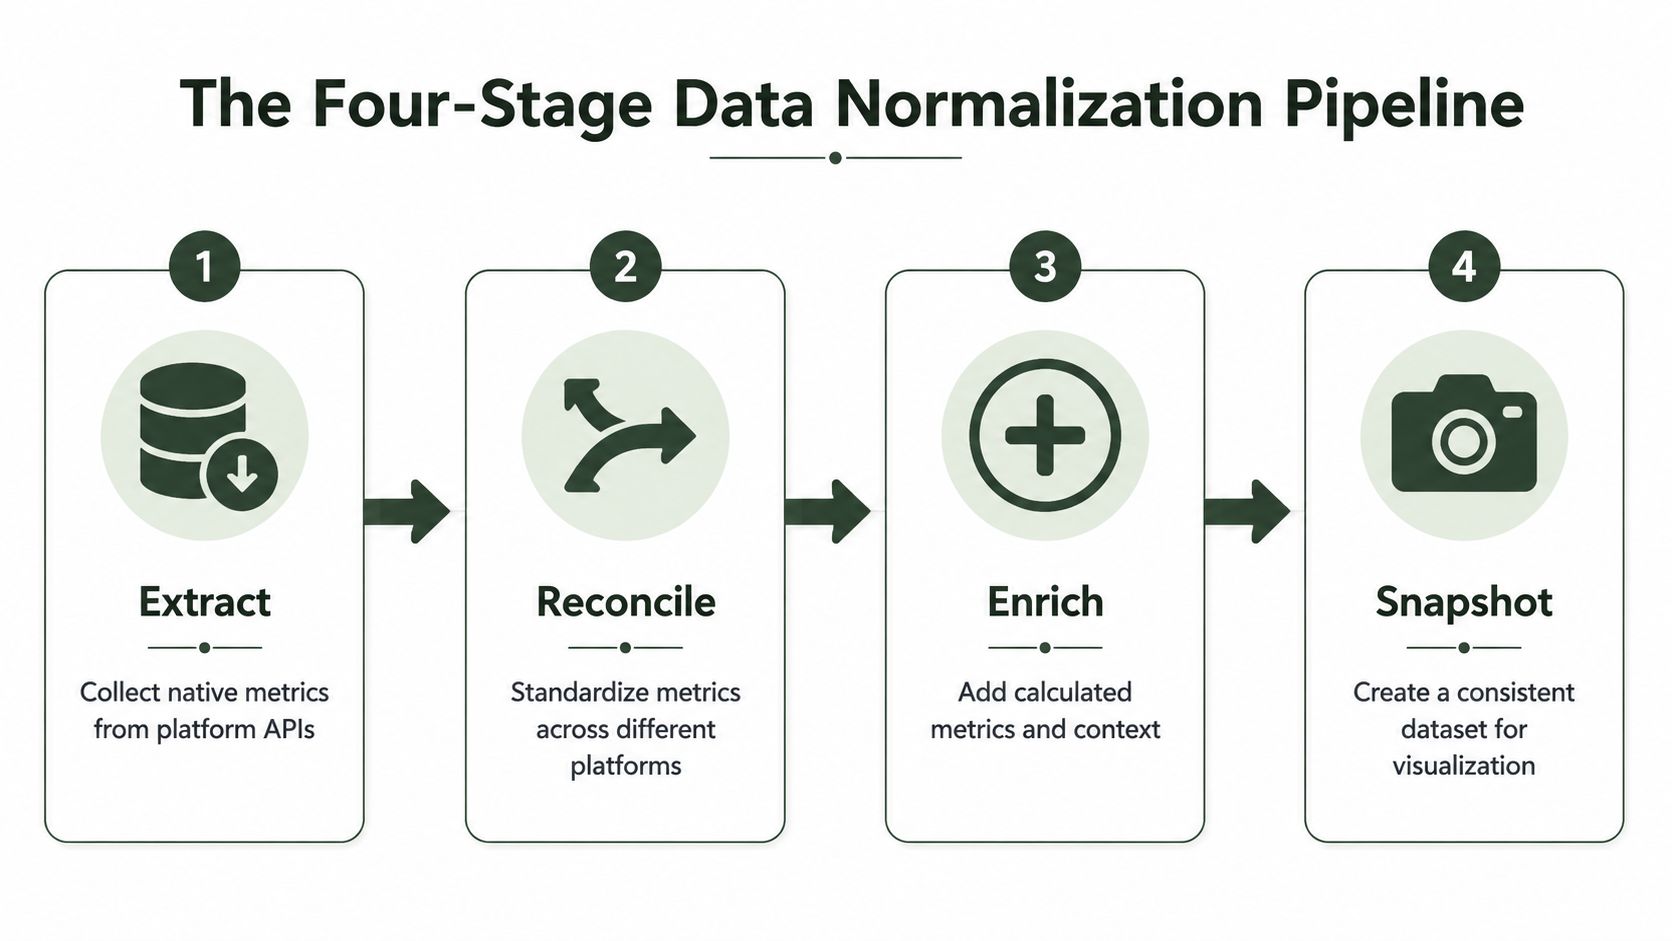
Charts should be the last step, not the first. Pulling exports into a dashboard before reconciling definitions creates polished inconsistencies. The reliable approach is a four-stage pipeline: extract, reconcile, enrich, and snapshot.
Extract and reconcile the raw records
Extract native metrics from each platform's approved data source or export. Preserve the original platform name, account identifier, post identifier, collection timestamp, and metric fields. Don't overwrite source values with transformed values. You need the original record for audit and troubleshooting.
Reconcile the records into a common model. Create a unified post_id, standardize timestamps to ISO format, align reporting timezones, and map platform-specific fields into a shared dictionary. Separate organic from paid rows. A post promoted after publication should retain both its organic performance and its paid delivery rather than becoming one blended total.
Enrich and snapshot the reporting dataset
Append content metadata such as theme, format, CTA, campaign, creator, and publishing time. Join UTM parameters and web analytics identifiers so the report can connect a post to sessions and downstream actions. Add promoted-versus-organic flags and paid cost rows, converting currency consistently before calculating CPA or return measures.
Deduplicate cross-posted content carefully. A single creative published on Instagram, LinkedIn, and TikTok should keep separate platform records, but it should also carry a shared campaign or content-family identifier. That lets analysts compare channel execution without treating the same creative as three unrelated ideas.
Snapshot the cleaned table at a defined reporting time. A snapshot prevents late-arriving platform data from altering a previously distributed report. It also makes week-over-week comparisons reproducible.
Keep the dashboard compact
Use a one-page dashboard with four zones:
- KPI strip: Awareness, engagement, traffic, and conversion values.
- Weekly trend chart: Lines for reach, engagement rate, clicks, or conversions where continuity matters.
- Platform grid: Comparable values by channel, with paid and organic separation.
- Content leaderboard: Top and bottom posts with theme, format, CTA, and outcome fields.
Choose charts by question. Use line charts for time trends, bars for platform comparisons, scatter plots for reach versus engagement, and a table for post-level diagnosis. Name queries by version, such as social_kpi_weekly_v1 and content_leaderboard_v1, then increment the version when definitions change. Teams reviewing audience composition and behavior can connect the reporting model to audience insights.
How to Prove Real Business Impact Beyond Vanity Metrics
Last-click attribution is useful, but it isn't a complete account of social's commercial role. Social often introduces a buyer, answers objections, creates a branded search, or supplies proof before another channel receives the final click. Platform restrictions and privacy changes make that undercounting structural, not merely a matter of poor dashboard configuration.
The tracked-versus-self-reported comparison makes the problem visible. The cited 2026 analysis found YouTube at 2.81% tracked versus 4.01% self-reported, Instagram at 1.06% versus 3.92%, TikTok at 0.29% versus 2.07%, Facebook at 0.78% versus 3.82%, and LinkedIn at 0.61% versus 4.12% (organic social conversion analysis). Treat these as different measurements, not competing truths. Native and web systems capture identifiable paths. Self-report captures remembered influence that may never appear in a clickstream.
Use a layered measurement stack
A credible social impact case combines several methods:
| Method | What It Captures | Main Weakness | Best Use Case |
|---|---|---|---|
| Native and web attribution | Identifiable clicks, sessions, conversions, and revenue | Misses untracked and assisted influence | Conversion reporting |
| Self-reported attribution | Channels buyers remember influencing them | Subject to recall and sampling bias | Upper-funnel influence |
| Incrementality testing | Change caused by exposure compared with a control | Requires careful experimental design | Budget decisions |
| Brand-lift surveys | Changes in awareness, consideration, or preference | Survey quality affects interpretation | Awareness campaigns |
| Branded search lift | Demand that appears after social exposure | Other campaigns can affect search | Demand creation |
| Share of voice | Relative visibility in relevant conversations | Visibility isn't revenue | Category and reputation analysis |
Use a simple assisted-influence model alongside the conversion table:
Assisted influence value = incremental conversions influenced by social × agreed contribution value
Finance will challenge the contribution value, so define it before the review. Use a conservative value based on an accepted conversion or margin measure, show the direct and assisted components separately, and document which evidence supports the estimate.
Matched-market holdouts can test whether exposed markets outperform comparable unexposed markets. Run the test on a recurring schedule appropriate to the campaign and sales cycle, then compare conversion or revenue outcomes against the control. Brand-lift surveys and branded search movement add corroboration, but they shouldn't be presented as proof of causality on their own.
Use Crowbert's ad ROI calculator to structure the direct-return calculation, but keep assisted influence as a separately labeled layer. That separation makes the business case more defensible than inflating one attribution number to represent every effect.
Automating Reporting With an AI Agent
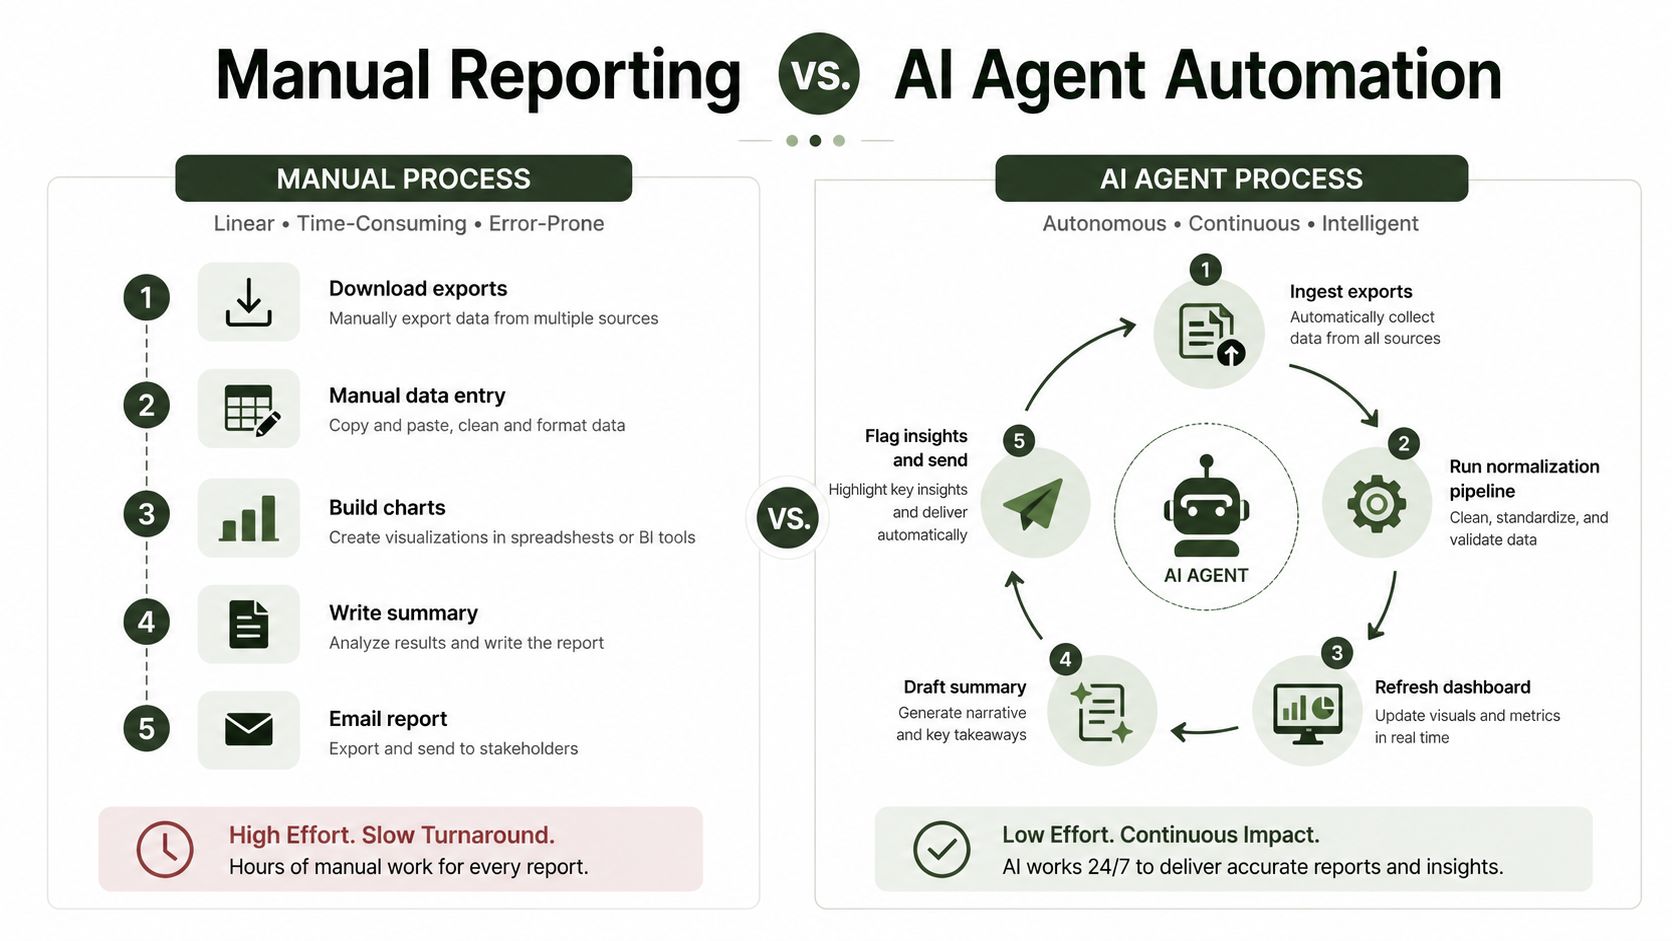
A reporting automation system should close the entire weekly loop, not merely schedule an export. An autonomous AI agent can ingest platform data, run the normalization pipeline, refresh the dashboard, draft the executive summary, flag anomalies, and send the review package to Slack. The agent executes recurring work, while people retain approval over definitions, interpretation, and spend.
Define the input and output contracts
The input contract should specify:
- Connected accounts: Which channels and profiles can be read.
- Warehouse tables: Where raw posts, normalized metrics, UTMs, costs, and conversions live.
- KPI dictionary: The approved formula, denominator, attribution window, timezone, and paid or organic rule for every metric.
- Business context: Campaign tags, reporting audience, current priorities, and known anomalies.
The output contract should be equally concrete. Stakeholders should receive a recap link, a PDF export when required, a Slack message with the headline movement, and links to the supporting dashboard and post-level evidence. Every generated statement should point back to source rows or a documented calculation.
Crowbert is one example of an autonomous AI social media platform that coordinates content, publishing, engagement, and performance analytics across major channels while keeping human approval in control. Its reporting workflow is relevant when the same operating system needs to move from performance evidence to approved execution. Teams comparing broader tool categories can consult this review of the best AI marketing tools.
Keep human checkpoints explicit
Humans should approve the KPI dictionary before the first report runs. They should sign off on the executive narrative when the explanation affects strategy, and they must make budget reallocation decisions. The agent can identify an unusual decline, propose a cause, and draft a response. It shouldn't change attribution rules or publish a strategic conclusion.
| Automation setup | Strength | Limitation |
|---|---|---|
| Manual spreadsheet | Flexible and easy to start | Repetitive, fragile, and difficult to audit |
| Native platform rules | Fast for single-channel alerts | Limited cross-channel context |
| Full agent workflow | Connects ingestion, interpretation, and delivery | Requires governed definitions and review points |
Choose a tool with an audit trail, versioned metric definitions, and reviewable prompts. The AI agent for social media should be treated as an accountable workflow component, not an unexplained black box.
Putting It All Together and FAQ
A working social media analytics report starts with a defined audience and a short list of decisions. Select the funnel KPIs, lock the template, connect native and business data, normalize the records, and set a weekly review time. Each month, revisit the metric definitions and benchmark set, but don't casually change formulas mid-period.
A practical launch week looks like this:
- Monday: Define the audience, business questions, KPI dictionary, timezone, and attribution rules.
- Tuesday: Connect platform exports or APIs, web analytics, UTMs, campaign metadata, and cost data.
- Wednesday: Build the normalized post-level table and validate a sample against native platform records.
- Thursday: Assemble the dashboard, leaderboard, executive summary, and anomaly rules.
- Friday: Review the first report with stakeholders, record objections, assign actions, and schedule the next refresh.
| Audience | Cadence | Format | Depth |
|---|---|---|---|
| Executives | Weekly or monthly | Fixed summary and scorecard | Business outcomes, risks, decisions |
| Channel owners | Weekly | Dashboard and post-level table | Creative, audience, timing, platform detail |
| Clients | Monthly or campaign-based | Branded report and review | Delivery, contribution, recommendations |
| Finance and leadership | Quarterly | Measurement review | Attribution, incrementality, assumptions |
Frequently Asked Questions
How should a report handle multiple currencies and timezones?
Convert paid cost rows into one agreed reporting currency before calculating CPA or return measures. Store the original currency and conversion rule for auditability. Normalize platform timestamps to the reporting timezone, then use identical period boundaries across channels.
How often should benchmarks be refreshed?
Use a historical baseline, a competitive set, and an industry aggregate, then re-benchmark after meaningful fixes or strategic changes. One industry workflow recommends quarterly re-benchmarking after fixes are implemented (Socialinsider's benchmarking guidance). Don't replace a stable baseline every time a single post performs unusually well.
What belongs on the executive summary slide?
Show the primary KPI movements, the business contribution that can be evidenced, the main explanation, the largest measurement limitation, and the decisions required. Put channel diagnostics, post examples, formulas, and source records in the supporting pages.
How can a team defend disputed numbers in a QBR?
Show the source platform values, normalized fields, formulas, date boundaries, paid or organic treatment, and attribution rules. Keep a versioned methodology note beside the report. If native and web numbers differ, explain the difference instead of forcing them into one total.
What changes when a brand enters a new platform or launches a disruptive campaign?
Create a new platform or campaign segment, preserve the old baseline, and mark the break in the trend. Define platform-appropriate rates before comparison, then collect enough comparable observations to establish a new reference point. Don't judge the new channel against a historical mix that never included it.
Crowbert provides an autonomous AI agent that can coordinate social media execution and reporting across connected channels, with human approval before publishing and strategic decisions. Visit Crowbert to see how its analytics, workflow automation, and approval controls can support a living social media analytics report.
About the Author
The team behind Crowbert building AI-powered marketing tools that help businesses of all sizes create professional campaigns, manage social presence, and drive real results.