10 KPIs for Social Media to Track in 2026
Learn which kpis for social media matter most, with formulas, channel-aware benchmarks, examples, and practical measurement workflows.
Follower count and likes are not a performance report. They tell you how large an account looks and how often people tap a visible button, but they don't show whether the audience is relevant, whether content creates intent, or whether social activity contributes to customer outcomes. A useful hierarchy moves from attention and interaction to audience quality, customer response, and business impact.
Benchmark context matters. A 2026 study covering 70 million posts found TikTok at a 3.70% engagement rate, compared with 0.48% on Instagram and 0.15% on Facebook, while brands posted an average of 5 times per week on both TikTok and Instagram (Dash Social benchmark data). Those figures aren't universal targets. They show why every KPI needs a platform, format, audience, and time period attached to it.
This ranked list starts with the metrics closest to business decisions. It covers engagement rate, CTR, conversion rate, reach, follower growth rate, share of voice, audience growth quality, sentiment, share rate, and response performance. Crowbert centralizes channel data, content execution, reporting, and approval in one workspace, with an autonomous AI agent coordinating work while a human retains publishing control. Explore the Crowbert features to see how that workflow supports measurement and action.
The ranges above come from a 2026 platform benchmark report by PicMim. Use them for directional comparison, not as promises. For a broader customer measurement system, also consider how social data can help you track churn indicators effectively.
Table of Contents
1. Engagement Rate
Business question: Does the audience find the content relevant enough to interact with?
Engagement rate measures likes, comments, shares, and saves against a defined audience base. A follower-based calculation is:
Engagement rate = total engagements ÷ total followers × 100
The denominator changes the meaning of the result. Some platforms and reporting tools use reach or impressions, so every dashboard should label the formula. Comparing TikTok and Instagram without that context can mislead, because distribution patterns and audience behavior differ. The 2026 Dash Social benchmarks reported TikTok at 3.70%, Instagram at 0.48%, and Facebook at 0.15%. Treat these figures as platform-specific reference points, not universal targets.
Engagement also varies in depth. Likes can indicate approval, while comments may reflect interest, disagreement, or an unresolved customer issue. Saves and shares often provide stronger evidence that content was useful enough to retain or distribute.

How to interpret the rate
Compare posts within the same platform, format, audience, and reporting period. Then separate interaction depth from total engagement. A post with fewer likes but more comments, saves, or shares may better support education or demand creation than a broadly liked image.
Centralized reporting can group results by topic, format, cadence, and publishing time. Crowbert can surface those patterns, send findings into content planning and rescheduling, and let an autonomous agent prepare workflow changes for human approval. For platform-specific tactics, see increasing engagement on Instagram.
2. Click-Through Rate
Business question: Is social content creating intent beyond the platform?
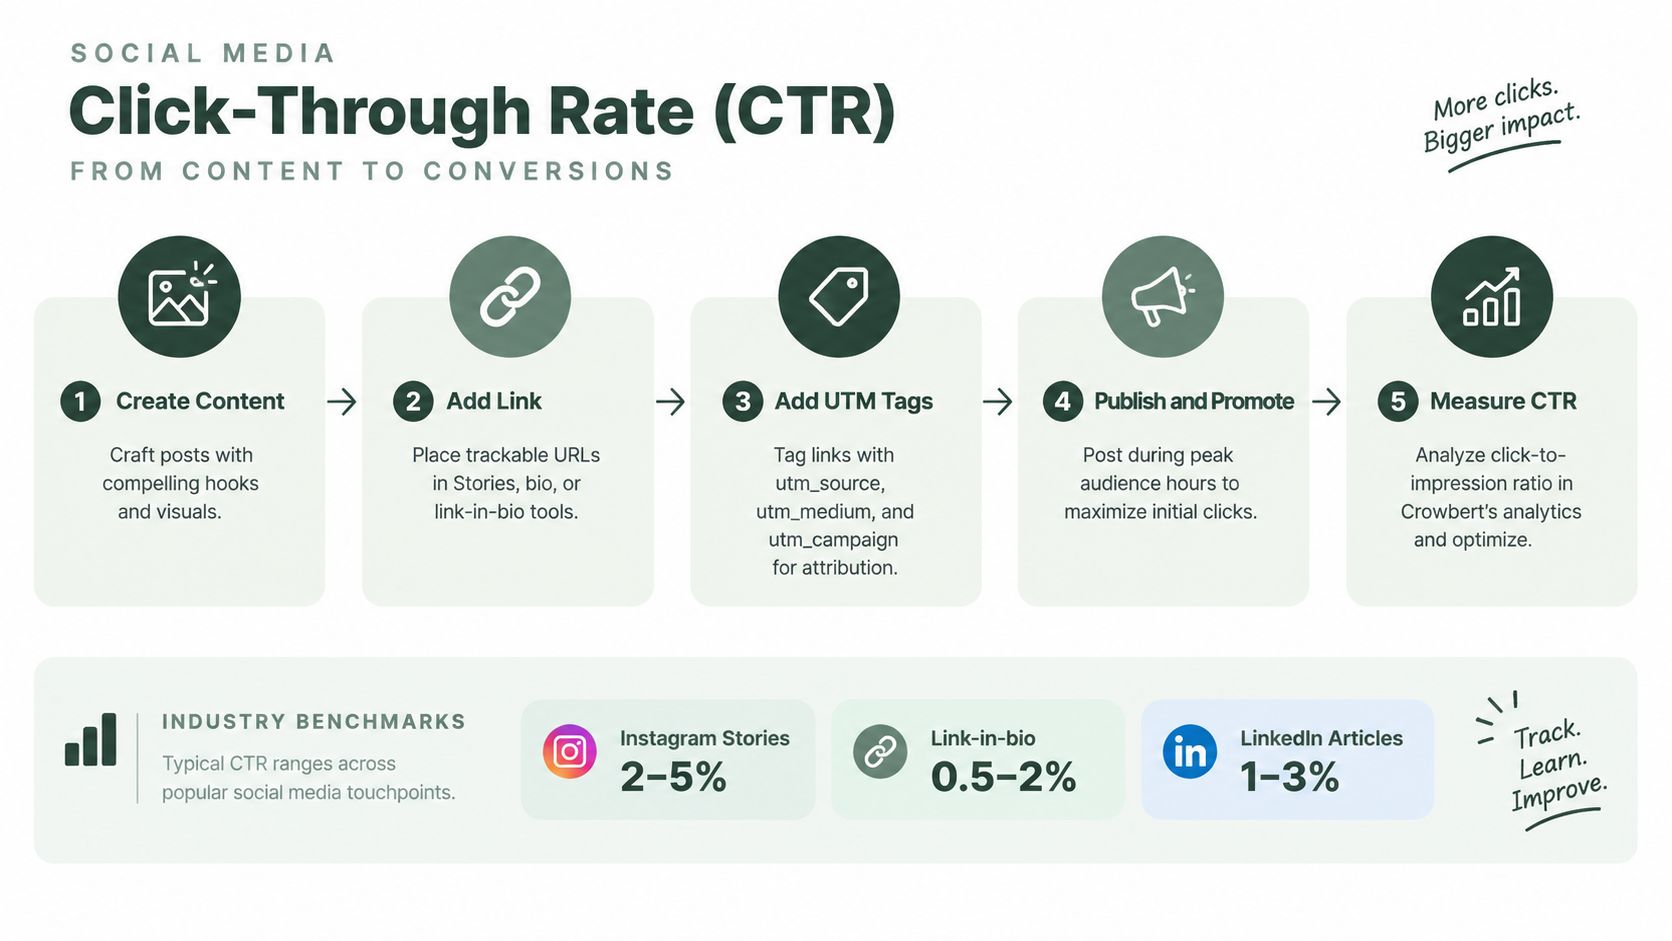
CTR measures link clicks against impressions:
CTR = clicks ÷ impressions × 100
It sits closer to business value than a like because the user takes an action that can lead to a landing page, product view, signup, or other funnel event. Yet CTR still needs context. A high click rate to a poorly matched page can produce weak conversions, while a lower rate from a precisely targeted audience may create better downstream value.
Benchmark reporting has expanded beyond organic interaction into monthly median CTR, median monthly CPC, ad spend growth, and social referral share, according to the Emplifi benchmark report. That evolution reflects a practical shift. Teams increasingly need to know whether posts generate traffic and action, not merely whether people react inside the feed.
Use consistent UTM parameters for source, medium, campaign, and content. Keep platform, format, and audience segments distinct so one strong post doesn't hide weaker traffic sources.
A useful diagnostic sequence is:
- Low impressions and low CTR: Distribution or creative may be limiting discovery.
- Healthy impressions and low CTR: The promise, hook, or call to action may be weak.
- Healthy CTR and low conversion rate: The landing page or offer may be mismatched.
- High CTR from an unqualified audience: The message may be attracting curiosity rather than intent.
Crowbert can connect publishing records with performance snapshots, while your analytics system remains the authority for website events. The broader measurement approach is covered in how to measure social media success.
3. Conversion Rate
Business question: Do social visitors complete the action the business needs?
Conversion rate measures completed outcomes against clicks:
Conversion rate = conversions ÷ clicks × 100
The conversion can be a purchase, lead form, signup, download, booking, or another defined event. The definition must be fixed before reporting begins. Otherwise, one campaign may count landing-page visits while another counts qualified leads, making the resulting rates misleading.
Attribution also requires discipline. Use platform event tracking where appropriate, UTM campaigns for traffic classification, and a consistent attribution window in your analytics or CRM. Don't assume a social click deserves full credit for every later sale. Social may introduce a buyer, assist a later conversion, or support retention without receiving the final recorded interaction.
A practical campaign record should include:
- Primary event: The one action that defines success.
- Supporting signals: CTR, landing-page engagement, and response activity.
- Attribution rule: The source and window used in reporting.
- Decision threshold: The condition that triggers a creative, audience, or landing-page change.
Crowbert's role is operational. Its agent can coordinate content creation, channel formatting, scheduling, publishing, analytics snapshots, and reporting, while approved campaign events remain connected to the appropriate measurement systems. For paid campaign planning, use the Crowbert ad ROI calculator.
A conversion framework is only as credible as its event definitions. Write those definitions down before the first post ships.
4. Reach
Business question: How many unique accounts received exposure, and did that exposure matter?
Reach counts unique accounts exposed to content. Impressions count displays, including repeated displays to the same account. Because platforms calculate these measures natively, analysts should preserve each platform's definitions rather than combine the figures as if they were interchangeable.
Reach answers an awareness question, not a business-outcome question. It helps assess launches, category entry, and distribution, but a high total can still reflect weak audience fit. A smaller, more relevant audience may produce stronger engagement, clicks, or qualified conversations. Treat reach as an upper-funnel KPI and connect it to the outcome that justifies the campaign.
The Xpoz 2026 KPI guidance cites 3 to 5 times more monthly impressions than follower count for a healthy organic account and 25% to 40% share of voice for category leaders. These are supplied benchmark claims, not universal targets. The first comparison uses impressions, not unique reach, so do not substitute one measure for the other.
Turn reach into a decision
Pair reach with a quality or outcome signal:
- Reach plus engagement rate: Did exposure create interaction?
- Reach plus CTR: Did exposure create intent?
- Reach plus conversion rate: Did exposure contribute to a defined outcome?
- Reach plus share rate: Did audiences extend distribution?
Interpret the ratio by channel. A change in format, publishing cadence, recommendation system, or metric definition can alter reach without indicating weaker content. Compare like-for-like periods within each platform before changing strategy, and store benchmark sources beside the reporting period.
Crowbert's analytics and calendar can connect format, timing, and distribution patterns to scheduling decisions. Its autonomous agent can prepare channel-specific variations and reschedule approved content, while a human retains approval over publication. Teams can also review content distribution choices alongside reach, rather than treating distribution as a separate reporting task.
5. Follower Growth Rate
Business question: Is the addressable audience expanding at a useful pace?
Follower growth rate measures new followers relative to the starting audience:
Follower growth rate = new followers ÷ starting follower count × 100
Use net growth when unfollows materially affect the account. Report the period beside the rate because weekly spikes, monthly averages, and quarterly movement answer different questions.
Follower growth is a lagging signal. Content earns attention, interaction, and distribution first, then some viewers choose to follow. A growth spike therefore deserves investigation, not automatic celebration. Identify the posts, topics, creators, formats, and channels associated with the change, then compare the new audience's engagement and conversion behavior with the existing audience.
Don't set one growth target across every network. TikTok, Instagram, LinkedIn, and X have different discovery mechanics, content conventions, and benchmark environments. A channel-specific report is more informative than a blended follower total.
Crowbert can associate content patterns and publishing cadence with follower movement, then use those findings to inform the calendar. The agent can draft and format follow-up content for each network, but a human should approve the editorial direction before publication. For practical audience-building ideas, read how to grow your following on Instagram.
6. Share of Voice
Business question: How much category attention belongs to the brand compared with relevant alternatives?
Share of voice measures a brand's mentions against all tracked mentions in its category:
Share of voice = your brand mentions ÷ total tracked category mentions × 100
The competitor set shapes the result. Include direct competitors and relevant adjacent players, then record the keywords, handles, hashtags, languages, and channels being monitored. A narrow query can overstate the brand's position by excluding conversations where competitors are active.
Benchmark ranges provide context, not universal targets. The Xpoz benchmark guidance cites 25% to 40% share of voice as a level category leaders may command. Treat that range as directional and specific to its source. Share of voice alone does not show whether attention is positive, relevant, or commercially valuable.
Pair visibility with meaning
Segment the metric before making a decision:
- Topic: Which problems or themes generate attention?
- Sentiment: Is visibility positive or negative?
- Audience: Are relevant buyers participating?
- Content source: Are mentions organic, creator-led, customer-led, or brand-generated?
- Time: Did a campaign change attention, or did a competitor go quiet?
Compare results by channel rather than relying on one blended category score. Crowbert can identify topics and publishing patterns associated with stronger visibility, then prepare channel-specific content for human approval. Social listening still captures broader category conversation. Approved outputs can be scheduled across supported networks, making share of voice a planning input instead of a retrospective chart.
7. Audience Growth Quality Index
Business question: Are new followers likely to become an active, relevant audience?
This index compares the engagement behavior of newly acquired followers with the existing audience. One simple formulation is:
Audience quality index = new-follower cohort engagement rate ÷ existing-audience engagement rate
A result above 1.0 means the new cohort engages more strongly than the existing audience. A result below 1.0 means it engages less. The calculation is a custom diagnostic, not a standardized platform KPI, so define the cohort period, engagement formula, and data source in every report.
The index helps separate audience expansion from audience inflation. A campaign can add followers while weakening the average response rate if those followers have little interest in future content. The reverse can also happen. A smaller acquisition campaign may attract people who interact more often and convert more readily.
Build the cohort carefully
Compare followers acquired through organic posts, paid campaigns, creator mentions, and other identifiable sources when the data allows it. Don't treat source labels as proof of quality. Evaluate subsequent engagement, clicks, responses, and conversions.
This metric is particularly useful when reviewing influencer activity or giveaway-style campaigns. A follower spike should trigger a cohort review rather than an immediate increase in publishing volume. If the new audience doesn't respond to later content, the account may need better targeting or a clearer content promise.
Crowbert's agent can prepare recurring audience analyses from available workspace data and flag changes for review. Human approval remains important because a quality score can reflect campaign context, not just audience value. A product launch, controversy, or format shift may temporarily change behavior.

8. Sentiment Analysis
Business question: What emotional direction is the conversation taking?
Sentiment analysis classifies mentions, comments, and messages as positive, negative, or neutral, often with a natural language model supporting the classification. A basic positive sentiment ratio is:
Positive sentiment ratio = positive mentions ÷ total classified mentions × 100
That formula is only useful if the classification is trustworthy. Sarcasm, slang, product names, mixed opinions, and customer-support language can confuse automated systems. Manual review remains valuable for checking whether the categories match the brand's language and industry.
Sentiment should never replace issue analysis. A falling score is a signal to inspect the words, topics, products, and experiences behind the change. The most useful output is often a ranked set of drivers, such as delivery complaints, pricing objections, product bugs, or praise for educational content.
Segment the metric by channel. Direct messages may contain support problems, while public comments may reflect campaign reactions. Combine sentiment with response time and response rate so the team can distinguish a perception issue from an unresolved service backlog.
Crowbert can surface engagement activity and support a quick-reply workflow across connected channels. Its agent can summarize recurring themes and prepare response drafts, but sensitive complaints, crisis replies, and policy decisions should require explicit human approval.
9. Share Rate
Business question: Is the audience willing to distribute the message to its own network?
Share rate measures shares or reposts against a chosen denominator:
Share rate = total shares ÷ impressions × 100
Some teams use followers instead. Don't combine the two definitions in one trend line. Shares represent a different form of value from likes because the user actively extends distribution. They can also carry negative meaning, especially when people circulate criticism, so pair share rate with sentiment and comment review.
A 2026 Emplifi benchmark report found that TikTok's median engagement rate in the final quarter of 2025 was twice Instagram's and 20 times Facebook's in median interactions. The implication for share analysis is straightforward. A single global share target won't account for the different interaction environments across channels.
Optimize for the network
Test share behavior by content type:
- Educational content: Does the audience pass along a useful framework?
- Opinion content: Do people repost a clear point of view?
- Practical content: Do saves and shares indicate future use?
- Community content: Do people tag colleagues or friends?
Track share velocity early in a post's life, but don't overreact to a temporary spike. A post may travel widely without attracting qualified visitors. Crowbert can identify high-share topics, adapt approved content to each platform, and reschedule related posts when the data supports continued distribution.
10. Response Time and Response Rate
Business question: Does the brand respond to customers and prospects reliably?
Response time measures the interval between an inbound message or comment and the first brand reply. Response rate measures the share of eligible inquiries that receive a response:
Response rate = responded inquiries ÷ eligible inquiries × 100
These metrics should be separated by channel, message type, business hours, and urgency. A public product question, a refund request, and a crisis complaint don't have the same service requirement. An average across all messages can hide the exact queue that needs attention.
Response metrics also belong in the business scorecard because social is often part of the customer experience, not only a distribution channel. A quick first reply may acknowledge receipt without resolving the issue, so track resolution quality separately where the workflow supports it.
A workable operating model includes:
- Routing: Assign sales, support, and general questions to the right owner.
- Triage: Prioritize issues involving safety, payment, access, or public escalation.
- Templates: Use approved starting points for recurring questions.
- Escalation: Send sensitive or complex cases to a human specialist.
- Review: Inspect unanswered and repeatedly reopened conversations.
Crowbert centralizes engagement notifications and quick replies, while its autonomous agent can organize incoming work and prepare responses. Nothing should ship without explicit human approval. That safeguard is essential when a reply could create a legal, financial, or reputational commitment.
Top 10 Social Media KPI Comparison
| Metric | Implementation complexity | Resource requirements | Expected outcomes | Ideal use cases | Key advantages |
|---|---|---|---|---|---|
| Engagement Rate | Low–Medium (track likes/comments/shares; platform nuances) | Basic analytics tools; post-level engagement and follower data | Indicator of content-audience fit and likely organic reach | Content optimization, creative testing, algorithm-driven growth | Early signal of resonance; actionable at scale |
| Click-Through Rate (CTR) | Medium (requires link tracking and UTM discipline) | UTM parameters, link infrastructure, analytics attribution | Traffic to site or landing pages; measurable intent | Lead generation, e‑commerce, campaign performance | Direct proxy for audience intent; comparable across channels |
| Conversion Rate | High (pixel/event setup and attribution) | Platform pixels, backend event tracking, robust analytics | Revenue, sign-ups, ROI measurements tied to social | Performance marketing, direct-response campaigns | Direct tie to business outcomes; optimizable for ROI |
| Reach | Low (platform-reported unique viewers) | Platform analytics; period aggregation | Top-of-funnel exposure and awareness scale | Brand awareness, PR, large-audience campaigns | Measures unique audience exposure; visibility indicator |
| Follower Growth Rate | Low–Medium (track follower deltas over time) | Follower data, cohort/time-period reporting | Momentum indicator of audience expansion | Growth tracking, stakeholder updates, launch phases | Simple growth metric; signals brand momentum |
| Share of Voice | Medium–High (competitor set and listening setup) | Social listening tools, defined competitor list | Competitive visibility and market attention | Competitive analysis, PR impact measurement | Shows relative market attention; informs positioning |
| Audience Growth Quality Index | High (multi-factor cohort analysis) | Advanced analytics, follower source and engagement linking | Predicts sustainability and value of new followers | Influencer vetting, quality-focused growth strategies | Distinguishes high- vs low-quality growth; reduces vanity-metric risk |
| Sentiment Analysis | Medium–High (NLP plus manual calibration) | Social listening/NLP tools and manual sampling | Brand perception trends; early warning for issues | Reputation management, customer experience, crisis monitoring | Reveals tone drivers; enables rapid response to risks |
| Share Rate | Low–Medium (track shares/reposts separately) | Platform share metrics, amplification tracking | Amplification potential and virality prediction | Viral content, B2B thought leadership, network-driven campaigns | Indicates endorsement and reach multiplication |
| Response Time & Response Rate | Medium (inbox tracking, timestamps, SLAs) | Unified inbox, staff or automation, routing systems | Improved satisfaction, higher conversion likelihood, reputation | Customer service, high-touch e‑commerce, support-driven brands | Drives customer satisfaction and conversion; prevents escalation |
Build a KPI System That Leads to Action
Ten KPIs are useful only when they form an operating scorecard. Group reach and share of voice under awareness, engagement rate and share rate under resonance, follower growth and audience quality under audience health, CTR and response metrics under intent and customer experience, and conversion rate under business impact. This structure prevents a team from treating every metric as equally important.
Assign one primary KPI to each campaign. Use supporting diagnostics to explain movement. An awareness campaign may prioritize reach, with share of voice and engagement rate as diagnostics. A demand campaign may prioritize conversion rate, with CTR, landing-page behavior, and response rate as supporting signals. A community campaign may use share rate or response rate as the lead indicator, depending on the intended action.
Preserve platform-native definitions. Don't blend impressions with reach, follower-based engagement with impression-based engagement, or public comments with private support messages. Benchmark labels should include the source, platform, format, reporting period, and calculation method. The supplied benchmark evidence makes this necessary. The Dash Social report covers 70 million posts, while other benchmark sources use different samples, definitions, and platform cuts.
Use UTM parameters and event tracking for traffic and conversions. Then review trends rather than isolated posts. A weekly operational review can identify scheduling, creative, and response issues, while a longer strategic review can determine whether the channel is attracting the right audience and contributing to business outcomes.
Crowbert is designed to coordinate this loop as an autonomous AI agent. It can support briefing, copy and creative production, channel-aware formatting, calendar management, scheduling, publishing, engagement workflows, analytics snapshots, and reporting. Its specialized agents can work across platforms inside a client sandbox, but human approval remains required before content ships. Teams evaluating a centralized workflow can calculate engagement with the Crowbert engagement rate calculator, explore solutions for agencies, or review Crowbert's comparison with Hootsuite.
A strong KPI system doesn't eliminate judgment. It makes judgment more disciplined by showing which question each metric answers, what evidence supports the comparison, and which action should follow.
For a broader social media engagement strategy, connect the scorecard to content decisions, ownership, approval rules, and reporting cadence.
Frequently Asked Questions
How much setup effort does a KPI system require?
Start with platform-native analytics, a documented calculation for each KPI, UTM conventions, and the business event that defines conversion. The effort increases when you add CRM, event tracking, social listening, or cohort analysis. Crowbert can centralize content, scheduling, engagement, analytics, and approval workflows, but your team still needs to define goals and access permissions.
Which social channels does Crowbert support?
Crowbert supports 15 platforms, including Instagram, TikTok, LinkedIn, X, Facebook, YouTube, Threads, Reddit, Pinterest, Bluesky, WhatsApp, and Telegram. Channel-aware formatting helps adapt captions, media, and publishing details to each network. Benchmark comparisons should still remain channel-specific.
How should I interpret benchmark rates?
Use benchmarks as directional context, not as universal targets. Check the source, sample, platform, format, period, denominator, and calculation method. TikTok's 3.70% rate in the Dash Social benchmark isn't directly interchangeable with every Instagram, Reels, or Facebook figure from another report.
How do I connect social activity to conversions?
Use UTM parameters for campaign and content identification, configure platform or website events, and define the attribution window before reporting. Compare clicks with completed events, then review assisted activity where your analytics or CRM supports it. Don't assign full credit to social without stating the attribution model.
Does Crowbert publish automatically without review?
No. Crowbert's agent can coordinate creation, scheduling, publishing preparation, engagement, analytics, and reporting end to end, but nothing ships without explicit human approval. That keeps autonomous execution inside a controlled workflow.
Crowbert brings KPI tracking closer to execution by connecting content creation, scheduling, publishing, engagement, analytics, and reporting through a dedicated autonomous AI agent. Visit Crowbert to see how a centralized, human-approved workflow can turn social media metrics into repeatable decisions.
About the Author
The team behind Crowbert building AI-powered marketing tools that help businesses of all sizes create professional campaigns, manage social presence, and drive real results.


